|
The following is the presentation made by Mr. Claude Vickers to the Board of Trustees of the Employees Retirement System of Georgia on December 13, 2007.
"Ladies and Gentlemen,
Thank you for the opportunity to present my concerns to you today. I served on this Board and the other state retirement boards for about eighteen years from 1982 until 1999. I understand the problems and what you are facing.
When I came on the Board, the funded percentage of the ERS was around 65%. There had been several months of adverse publicity in the very late seventies about the funding problems of the system. An actuarial study was commissioned. The administration and legislature didn’t like the results so they commissioned a second study by a different firm, but they didn’t like this one either. Then they commissioned a third firm to review the first two studies. The first two studies were determined to be accurate so the administration and legislature reluctantly conceded that there was a problem. This publicity and these studies were the impetus for the creation of what we know today as the “New Plan” in 1982. In the early eighties the Office of Planning and Budget (OPB) Director, the State Auditor, the Director of the Legislative Budget Office (LBO) and the Director of the Fiscal Division began to discuss how the retirement systems’ funding affected other financial aspects of State Government. In particular, they recognized that the bond rating agencies were concerned about the funding problems of the systems and that a AAA bond rating would reduce the cost of debt service if it could be attained. They also recognized that correcting the retirement systems’ funding problem would take several years, but that it would “pay-off” in future interest savings. My point is your actions can impact other areas of State Government.
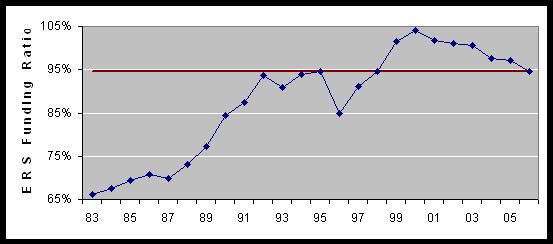
I have three points I want to make to you today. My first point is that as reflected by Chart 1:
The funded percentage has fluctuated from a low of 66.1% in 1983 to a high of 104% in 2000. In over one-half—14—of those years the funded percentage was less than 94.5%. Throughout the 1980s and early 1990s, the employer contribution rate was increased several times and up to a high of 18.16%, trying to address the funding problem.
This chart shows how the employer rate was increased and how the funded percentage increased during the 1980s and 1990s. In the nineties, a number of things happened.
Throughout these years, the funded percentage bounced around, but continued to improve until it hit 100% in 1999 and 104% in 2000.
Then in 2001 came a very significant change; the employer contribution was reduced by almost one third from 14.5% to 10.41%. As you can see, this is the largest change in contributions, either up or down, in the history of the system. As the chart shows, the contribution rates were changed by small amounts both up and down to adjust the funded percentage except for the 2001 change. As a result of this decision the funded percentage began to plummet until it has reached 94.5% in 2006.
Now, 94.5% is not bad. What concerns me is that the trend is downward and shows no sign of changing. Even though this trend has been going on for a while, I’m not aware of any attempts to make changes except to continue to study the situation.
I’m sure that some of you expected me to come here today and ask that you reconsider your COLA decision. Instead, what I am more concerned about is what has been presented as justification for that decision; that is that the funded percentage of the ERS has dropped to an “alarming” 94.5%. Corrections of this problem can only occur during the Governor’s development of his budget proposal and the Legislature’s passage of the Appropriations Act. We are only days away from where it will be too late for this year and another year will pass.
My second point is that the most recent newsletter sent out by the ERS states that members of the ERS contribute at a rate significantly less than the members of the TRS. You’ve seen this chart before.
My contention is that the 4.75% pick-up applies to both the Old Plan and New Plan members not just the old plan members as is shown here.
This is what I believe it should look like:
I would encourage you to ask the Attorney General’s Office for clarification on this point.
Prior to 1980, the employee contribution for the “old plan” was 5%. In 1980 the Employee contribution was reduced to 0.25% because of the decision to “pick-up” 4.75% of the employee contributions in lieu of an 8.5% salary increase. Teachers were given 9.5% salary increases that year and it has compounded for the last 28 years. Consequently, the salaries of State employees have not experienced that compounding. The State has benefited financially from this retirement “pick-up” because of the compounding that did not occur for those 28 years.
Regardless, a “new plan” was created in 1982 for new employees. Then in 1991 the employee rate for all members was increased to 1.25%. My contention is that because of the employee pick-up, the members of both the ERS Old Plan and ERS New Plan are effectively contributing 6% while TRS members contribute 5%. This is contrary to the opinion in the most recent ERS Newsletter.
My third point is also demonstrated on this chart. The ERS is providing benefits to its members with its total contributions being 20% less than the TRS. The most recent ERS newsletter makes a point of comparing the ERS with the TRS and states that the benefits are close to the same. That’s a true statement. But, the recent COLA decision, if continued in the future will soon make this statement untrue. My contention is that an additional 2.62% contribution for the ERS to make it equal the TRS would partially if not fully support pre-funding the COLAs and may even begin to increase funded percentage of the ERS.
Once again, thank you for your attention.
- - - End of Mr. Vickers' presentation to ERS - - -
Note: The funding percentages referred to by Mr. Vickers in his presentation appear at the bottom of the first chart. The numbers are very small and hard to read. Below is a chart which shows the funding percentages for the same years taken from the first chart. The red line is drawn at the 94.5 percent funding level. This chart below was not a part of the presentation but is included here for the readers information and understanding.
|